9. Weather Station
This chapter describes the hard/software setup of a weather station whose measurements are to be exposed via OGC protocols like WMS, WFS and in particular SOS.
9.1. Introduction
In 2008/2009 Geonovum acquired a Davis Vantage Pro II Weather station. This station was/is mounted on the roof of Geonovum building. The outside station-sensors measure barometric pressure, temperature, humidity, rainfall, wind speed and direction. Data is continuously sent (wireless, via RF) to a base station, a.k.a. the “console”. The console has a Davis WeatherLink® hard/software add-on that is able to act as a data-logger and provides connectivity over USB.
Data from the weather station was extracted and published to the 52N SOS via a special purpose PC application. The results of this project have been described in a Geo-Info magazine article (2010-1).
As part of the SOSPilot project, we will now “revive” the Davis Weather station and connect its data stream to the SOSPilot infrastructure simliar to the RIVM AQ datastream. Eventually, the goal is to expose the station weather data to OGC services like WMS, WFS and in particular SOS.
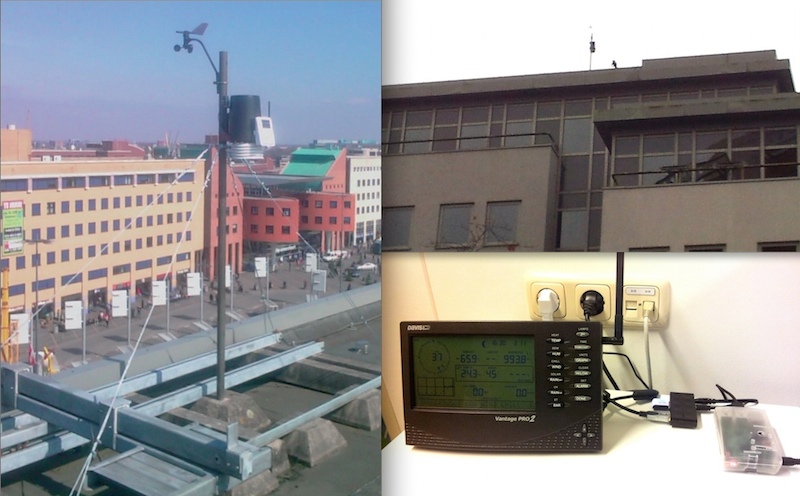
Figure 0 - Geonovum Davis VP2 Weather Station and Console connected to RPi
As we cannot connect the weather base station (USB), directly to the SOSPilot server “in the cloud”, an intermediate “middleman” hard/software component will be required. The main functions of this component are to acquire data from the base station and to transform and publish this data to the SOSPilot server (VPS).
To this end a Raspberry Pi (RPi) microcomputer has been chosen. The RPi is a cheap (around $25,-) credit-card-sized microcomputer that can run free OS-es like Linux (Raspbian, a Debian version) and allows connectivity to USB, WIFI, GSM etc. The RPi is popular with weather amateurs (and various other IoT projects as well).
9.2. Overview
The overall architecture is depicted below.
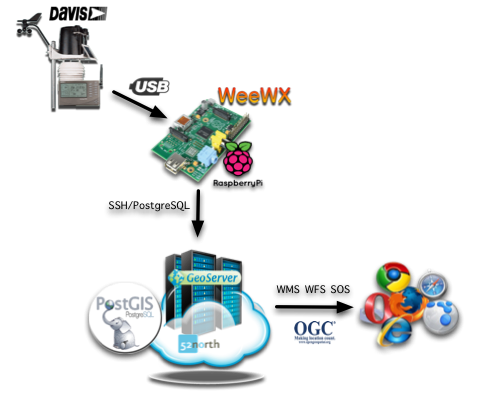
Figure 1 - Global Setup from Weather Station Through OGC Services
These components and their interconnections operate as follows.
The Davis weather station is connected to a Raspberry Pi (RPi) micro computer via USB trough the Davis WeatherLink®.
The RPi runs the Raspbian OS with the weather data software weewx. The weewx daemon continuously reads raw weather sample data from the Davis weather station and stores this data locally in a (SQLite or MySQL) database. These measurements, called weewx Archive Records are typically a 5-minute summary of multiple samples (weewx Loop Records) collected every few seconds.
An ETL process based on Stetl transforms and syncs data from the SQLite weather archive database to a remote PostgreSQL server in a “Cloud Server” (the Ubuntu VPS used in the project).
Other weewx plugins generate reports with statistics and summaries. These are synced regularly to be viewed as webpages in a browser.
The VPS runs GeoServer to serve the weather data directly from the Postgres/PostGIS database, using specialized PostgreSQL VIEWs, as WMS, WMS-Time and WFS.
In addition the VPS runs a Stetl ETL process that transforms and and publishes the weather data from PostgreSQL using the SOS-T protocol to the 52North Sensor Web Application server. The latter provides a SOS (Sensor Observation Service). Via the web browser various WMS/WFS and SOS client applications are invoked.
All client applications can be found and accessed via the project landing page: sensors.geonovum.nl:
- weather reports via: sensors.geonovum.nl/weewx
- WMS/WMS-Time/WFS via: sensors.geonovum.nl/heronviewer
- SOS via SOS client apps: sensors.geonovum.nl
The next sections will expand on this overview.
9.3. Architecture
The global architecture is depicted below. In all figures in this section the arrows denote the flow of (weather) data. Circles denote continuous data transformation processes. Rectangles denote application servers or services.
The figure below depicts the software architecture at the global level. ETL (Extract, Transform, Load) processes extract and transform raw weather data from the Davis weather station and publish the transformed data to a variety of application servers/services. Each of these servers/services will provide standard (web) APIs through which client applications can fetch (weather) data.
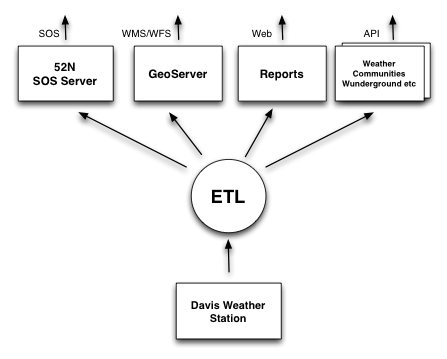
Figure 2 - Global Software Architecture
- SOS via the 52N SOS application server
- WMS/WMS-Time/WFS via: GeoServer
- weather reports via standard Apache webserver
- weather APIs via weather-communities like Weather Underground
This global architecture from Figure 2 is expanded into a more detailed design in Figure 3. This shows the various software and storage components, in particular the realization of the ETL-processing.
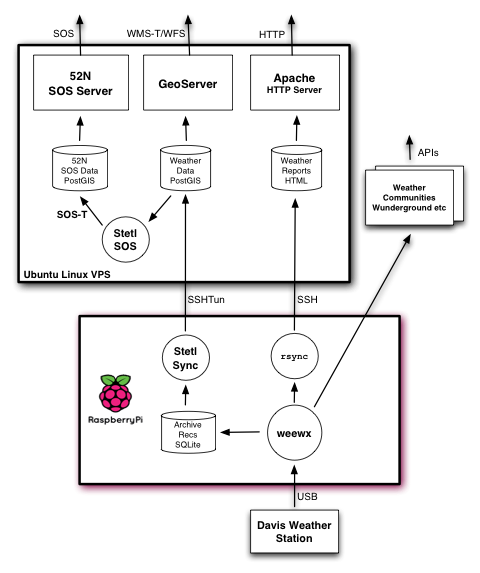
Figure 3 - Detailed Software Architecture
The (data) flow in Figure 3 is as follows.
- data is sampled by the
weewxdaemon from the Davis Weather station - weewx stores archive records in a SQLite database
- the Stetl Sync process reads the latest data from SQLite database
- Stetl Sync publishes these records unaltered to a PostgreSQL database (table:
measurements) - several specialized PostgreSQL VIEWs will filter and convert the raw archive data and JOIN data records with the
stations(location) table date - the PostgreSQL database (VIEWs) serve directly as data sources for GeoServer WMS/WFS Layers
- GeoServer will also provide a WMS-Dimension (-Time) service using the record timestamp column
- the Stetl SOS process reads data from PostgreSQL and transforms this data to SOS-T requests, POSTing these via SOS-T to the 52North SOS
weewxalso creates and publishes weather data reports in HTML to be serverd by an Apache server- in addition
weewxmay publish weather data to various weather community services like Weather Underground (optional)
The above components are divided over two server machines.
- the Raspberry Pi:
weewxand Stetl Sync - the Ubuntu Linux VPS: GeoServer, SOS server and Apache server plus the PostgreSQL/PostGIS database and the Stetl SOS ETL
Connections between the RPi and the VPS are via SSH. An SSH tunnel (SSHTun) is maintained
to provide a secure connection to the PostgreSQL server on the VPS. This way the PostgreSQL server
is never exposed directly via internet. Each of these components are elaborated further below.
Sources for this architecture can be found in GitHub.
- ETL, database and services: https://github.com/Geonovum/sospilot/tree/master/src/weather
- Raspberry Pi system setup: https://github.com/Geonovum/sospilot/tree/master/src/raspberry
- weewx-specific: https://github.com/Geonovum/sospilot/tree/master/src/weewx
In addition, weewx will be configured to report weather data to the Weather Underground personal weather station network at http://www.wunderground.com.
9.4. Raspberry Pi
A Raspberry Pi will be setup as a headless (no GUI) server. Via a USB Cable the Pi will be connected to the Davis datalogger cable. The Pi will run a Debian Linux version (Raspbian) with the free weewx weather server and archiver. weewx will fetch samples from the Davis weather station, storing its summaries regularly (typically every 5 mins) in a MySQL or SQLite archive table. weewx can also can publish data to community Weather networks like Wunderground.
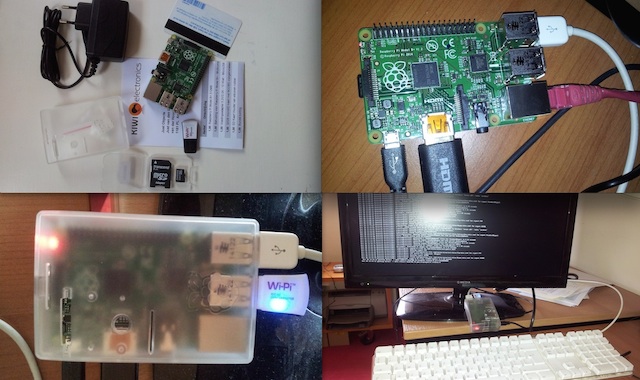
Figure 4 - Raspberry Pi Package through Install
See the raspberrypi-install section for the full hardware setup and software installation of the RPi for the project.
9.5. Weather Software
The choice is weewx with SQLite. weewx is installed as part of the raspberrypi-install. The weewx configuration for the Davis station is maintained in GitHub https://github.com/Geonovum/sospilot/tree/master/src/weewx/davis. After a first test using our WeatherStationAPI custom driver, the Geonovum Davis weather station will be connected.
The web reporting is synced by weewx every 5 mins to to our main website (using rsync over SSH):
http://sensors.geonovum.nl/weewx. This will take about 125kb each 5 mins.
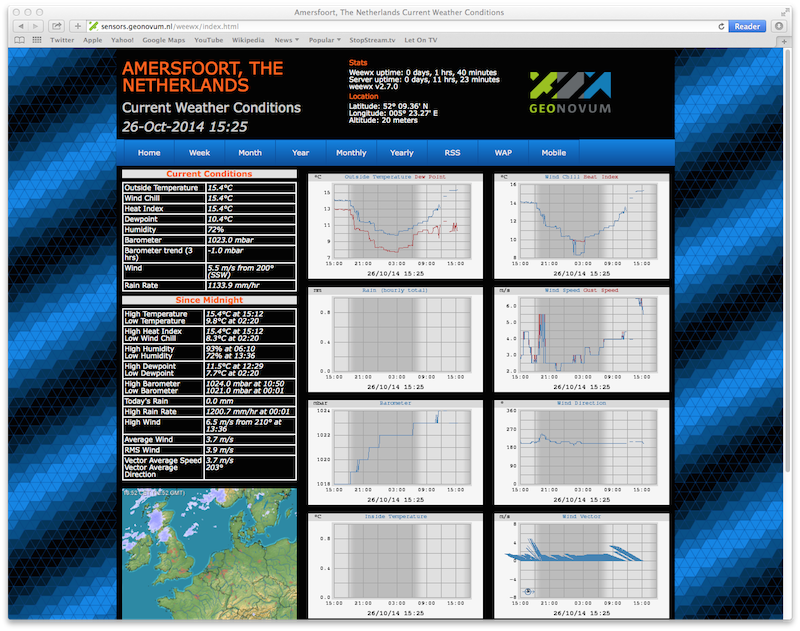
Figure 5 - weewx standard report screenshot
In addition weewx has been configured to report to the Weather Underground community site. The station is registered as IUTRECHT96, http://www.wunderground.com/personal-weather-station/dashboard?ID=IUTRECHT96.
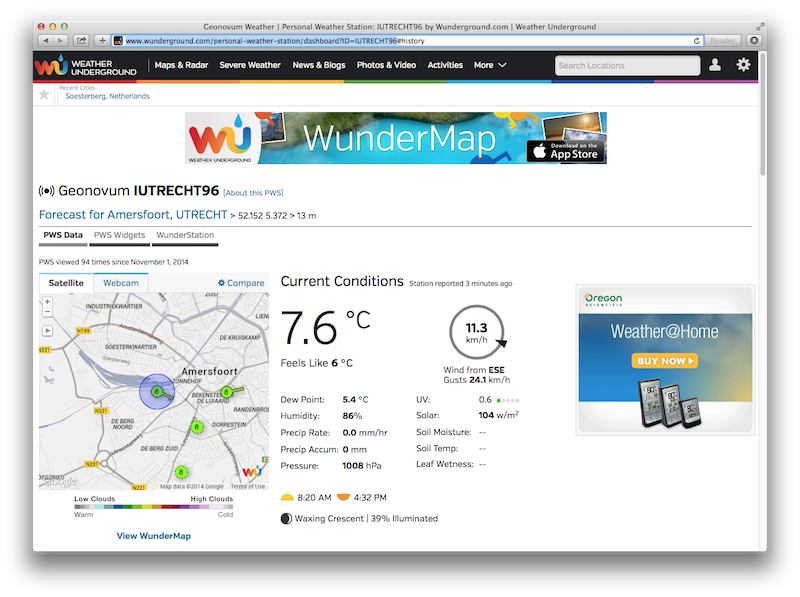
Figure 6a - Geonovum station on Weather Underground
Also, weewx has been configured (in sept 2015) to report to the MET UK Weather Observations Website (WOW). The station is registered with WOW site ID 929236001, http://wow.metoffice.gov.uk/sitehandlerservlet?requestedAction=READ&siteID=929236001. The Dutch KNMI has a localized version, called WOW-NL.
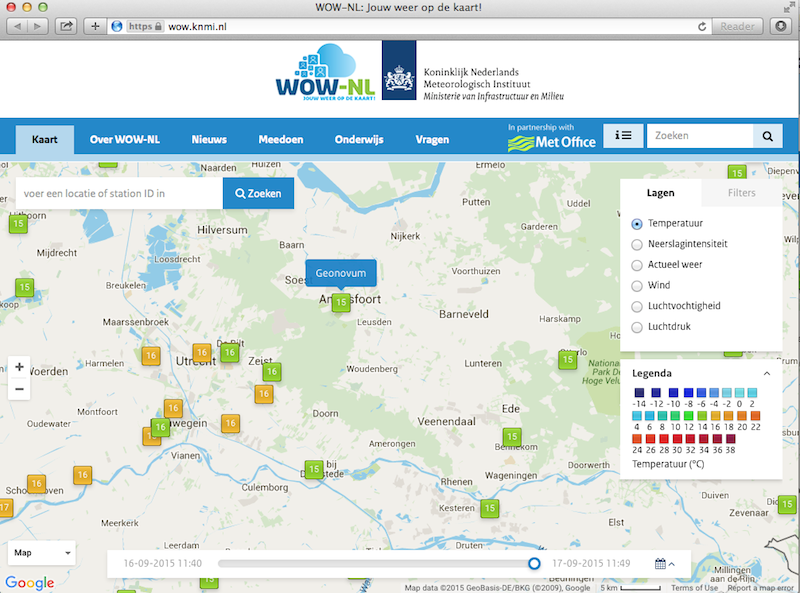
Figure 6b - Geonovum station on KNMI Weather Observations Website (WOW-NL)
9.6. PostgreSQL Database
The PostgreSQL database plays a central role. The 52North SOS will maintain its own tables.
For the Stetl ETL and GeoServer datasources the following tables and VIEWs are created in the weather
schema.
DROP SCHEMA weather CASCADE;
CREATE SCHEMA weather;

-- Raw measurements table - data from weewx weather archive or possibly other source
-- all units in US metrics assumed!
DROP TABLE IF EXISTS weather.measurements CASCADE;
CREATE TABLE weather.measurements (
  dateTime             INTEGER NOT NULL UNIQUE PRIMARY KEY,
  station_code         INTEGER DEFAULT 33,
  usUnits              INTEGER NOT NULL,
  interval             INTEGER NOT NULL,
  barometer            REAL,
  pressure             REAL,
  altimeter            REAL,
  inTemp               REAL,
  outTemp              REAL,
  inHumidity           REAL,
  outHumidity          REAL,
  windSpeed            REAL,
  windDir              REAL,
  windGust             REAL,
  windGustDir          REAL,
  rainRate             REAL,
  rain                 REAL,
  dewpoint             REAL,
 .
 .
 .
);


--
-- Name: stations; Type: TABLE; Schema: weather; Owner: postgres; Tablespace:
--
DROP TABLE IF EXISTS weather.stations CASCADE;
CREATE TABLE weather.stations (
    gid integer NOT NULL UNIQUE PRIMARY KEY,
    point geometry (Point,4326),
    wmo character varying,
    station_code integer,
    name character varying,
    obs_pres integer,
    obs_wind integer,
    obs_temp integer,
    obs_hum integer,
    obs_prec integer,
    obs_rad integer,
    obs_vis integer,
    obs_clouds integer,
    obs_presweather integer,
    obs_snowdepth integer,
    obs_soiltemp integer,
    lon double precision,
    lat double precision,
    height double precision
);

CREATE INDEX stations_point_idx ON stations USING gist (point);

INSERT INTO weather.stations (gid, point, wmo, station_code, name, obs_pres, obs_wind, obs_temp, obs_hum, obs_prec, obs_rad, obs_vis, obs_clouds, obs_presweather, obs_snowdepth, obs_soiltemp, lon, lat, height)
VALUES (1, ST_GeomFromText('POINT(5.372 52.152)', 4326), 'Davis Vantage Pro2', 33,'Geonovum',       1,1,    1,      1,      1,      0,      0,      0,      0,      0,      0, 5.372, 52.152, 32.4);

-- VIEWS

-- SELECT to_timestamp(datetime), "datetime","pressure","outtemp" FROM "weather"."measurements"
DROP VIEW IF EXISTS weather.v_observations CASCADE;
CREATE VIEW weather.v_observations AS
  SELECT
    meas.datetime,
    meas.station_code,
    stations.name as station_name,
    to_timestamp(datetime) as time,
    round(((outtemp-32.0)*5.0/9.0)::numeric) as outtemp_c,
    round((windSpeed*1.61)/3.6::numeric) as windspeed_mps,
    round((windGust*1.61)/3.6::numeric) as windgust_mps,
    round(windDir::numeric) as winddir_deg,
    round(((windchill-32.0)*5.0/9.0)::numeric) as windchill_c,
    meas.rainRate,
    round((pressure*33.8638815)::numeric) as pressure_mbar,
    round(outhumidity::numeric) as outhumidity_perc,
    stations.point as point
  FROM weather.measurements as meas
  INNER JOIN weather.stations AS stations
      ON meas.station_code = stations.station_code ORDER BY datetime DESC;

-- Laatste Metingen per Station
DROP VIEW IF EXISTS weather.v_last_observations CASCADE;
CREATE VIEW weather.v_last_observations AS
  SELECT DISTINCT ON (station_code) station_code,
    station_name,
    datetime,
    time,
    outtemp_c,
    windspeed_mps,
    windgust_mps,
    winddir_deg,
    windchill_c,
    rainRate,
    pressure_mbar,
    outhumidity_perc,
    point
  FROM weather.v_observations;
The raw weather data is stored in the measurements table (US units).
In order to make the tables/VIEWs geospatially enabled, a stations table is added.
The stations table is modeled after existing KNMI station data. Only a single station is
added for now, the Geonovum Davis station. The measurements table has a station_code
column to facilitate JOINs with the stations table.
Via VIEWs more simple and geospatially-enabled data is created. Also the VIEWs take
care of conversion from US to metric units. The weather.v_observations VIEW contains
a selection of weather characteristics joined with station data. weather.v_last_observations
contains the last (current) observations per station. Below an example of data in the
view.
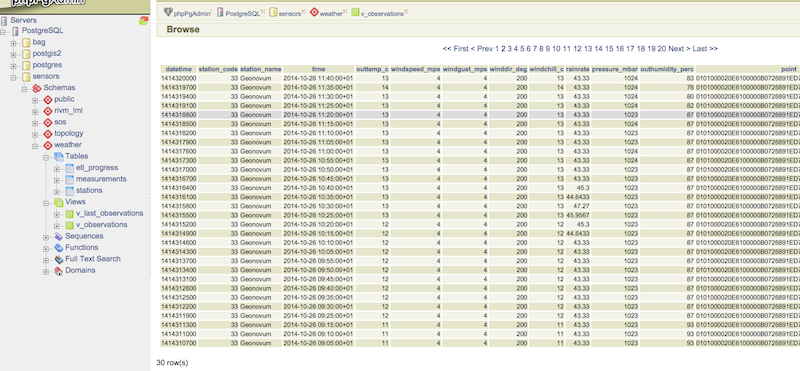
Figure 7 - PostgreSQL weather.v_observations VIEW
9.7. Stetl Sync
This section describes the Stetl Sync processing within the RPi. Effectively
this process will synchronize the latest data from the weewx database to
a remote PostgreSQL database on the VPS.
All sources can be found here.
weewx stores ‘archive’ data within a SQLite DB file weewx.sdb. Statistical data is derived from this data. Within weewx.sdb there is a single table archive. The database/table structure (only relevant fields shown).
CREATE TABLE archive (
    dateTime INTEGER NOT NULL UNIQUE PRIMARY KEY,
    usUnits INTEGER NOT NULL,
    interval INTEGER NOT NULL,
    barometer REAL,
    pressure REAL,
    altimeter REAL,
    inTemp REAL,
    outTemp REAL,
    inHumidity REAL,
    outHumidity REAL,
    windSpeed REAL,
    windDir REAL,
    windGust REAL,
    windGustDir REAL,
    rainRate REAL,
    rain REAL,
    dewpoint REAL,
    windchill REAL,
    ....
);
Most of the Stetl Sync processing can be realizeed with standard Stetl components like for SQLite input and PostgreSQL publishing. Only synchronization tracking needs a small Stetl input component WeewxDBInput. This component keeps track of the last archive data record synced within a PostgreSQL record. At a later stage this may also become a Stetl component so the complete ETL could be effected in Stetl.
The Stetl config is as follows.
# weewx archive data in SQLite to Postgres/PostGIS output - Stetl config
#
# Just van den Broecke - 2014
#
# Incrementally reads raw weewx archive records and publishes these to
# PostGIS.

# The main Stetl ETL chain
[etl]
chains = input_weewx_db|output_postgres_insert


# for reading files from weewx SQLite, tracking progress in Postgres
[input_weewx_db]
class = weewxdbinput.WeewxDbInput
host = {host}
port = {port}
database = {database}
user = {user}
password = {password}
schema = {schema}
progress_query = SELECT * from etl_progress WHERE worker = 'weewx2postgres'
progress_update = UPDATE etl_progress SET last_id = %d, last_time = '%s', last_update = current_timestamp WHERE worker = 'weewx2postgres'
table = archive
query = SELECT * from archive WHERE dateTime > %d ORDER BY dateTime LIMIT 100
database_name = {weewx_db}
output_format = record_array

[output_std]
class = outputs.standardoutput.StandardOutput

# For inserting file records
[output_postgres_insert]
class = outputs.dboutput.PostgresInsertOutput
input_format = record_array
host = {host}
database = {database}
user = {user}
password = {password}
schema = {schema}
table = {table}
key=dateTime
The target table is the PostgreSQL weather.measurements table depicted above.
The synchronization state is tracked in a PostgresQL table. A single worker (see Stetl config above) is inserted as well:
-- ETL progress tabel, houdt bij voor ieder ETL proces ("worker") wat het
-- laatst verwerkte record id is van hun bron tabel.
DROP TABLE IF EXISTS weather.etl_progress CASCADE;
CREATE TABLE weather.etl_progress (
  gid          SERIAL,
  worker       CHARACTER VARYING(25),
  source_table CHARACTER VARYING(25),
  last_id      INTEGER,
  last_time    CHARACTER VARYING(25) DEFAULT '-',
  last_update  TIMESTAMP,
  PRIMARY KEY (gid)
);

-- Define workers
INSERT INTO weather.etl_progress (worker, source_table, last_id, last_update)
  VALUES ('weewx2postgres', 'sqlite_archive', 0, current_timestamp);
The Stetl Sync process is scheduled via cron to run typically every 4 minutes.
# Cronfile for ETL processes on Raspberry Pi

SHELL=/bin/sh
PATH=/usr/local/sbin:/usr/local/bin:/sbin:/bin:/usr/sbin:/usr/bin
SOSPILOT=/opt/geonovum/sospilot/git

# Run ETL step 1: Raw weewx data from SQLite to remote Postgres DB on VPN
*/4 * * * * cd $SOSPILOT/src/weather/weewx2pg; ./pi-etl.sh >> /var/log/sospilot/weewx2pg.log 2>&1
The pi-etl.sh shell-script will first setup an SSH tunnel, then call the Stetl-wrapper weewx2pg.sh and
then tear down the SSH-tunnel.
#!/bin/bash
#
# Script to invoke ETL on the Raspberry Pi
# Uses an SSH tunnel to connect to Postgres on the VPS
#

# Kill possible (hanging) background SSH tunnel
function killTunnel() {
    pstree -p sadmin | grep 'ssh(' | cut -d'(' -f2 | cut -d')' -f1|xargs kill -9 > /dev/null 2>&1
}


# Kill possible (hanging) background SSH tunnel
killTunnel

# Setup SSH tunnel to remote host
ssh -f -L 5432:sensors:5432 sadmin@sensors -4 -g -N
sleep 10
ps aux | grep 5432

# Do the ETL
./weewx2pg.sh

# Kill the background SSH tunnel
killTunnel
The weewx2pg.sh script is as follows.
#!/bin/bash
#
# ETL for converting/harvesting weewx archive data into PostGIS
#

# Usually requried in order to have Python find your package
export PYTHONPATH=.:$PYTHONPATH

stetl_cmd=stetl

# debugging
# stetl_cmd=../../../../stetl/git/stetl/main.py

# Set Stetl options

. ../options.sh

$stetl_cmd -c weewx2pg.cfg -a "$options"
The options.sh script will set various (shell) variables to be substituted in the Stetl
config.
#!/bin/sh
#
# Sets host-specific variables
# To add your localhost add options-<your hostname>.sh in this directory

# All file locations are relative to the specific ETL subdirs like weewx2pg
. ../options-`hostname`.sh

export options="host=localhost port=5432 weewx_db=$WEEWX_DB user=$PGUSER password=$PGPASSWORD database=sensors schema=weather table=measurements"
By calling the options-<hostname>.sh script, various host-specific/secured variables are set.
9.8. GeoServer
The stations table and two VIEWs are used as data sources for weather-layers:
weather.stationsas a source for a WMS Layersensors:weather_stationsweather.v_observationsas a source for a timeseries WMS-Dimension Layersensors:weather_observationsusing continuous interval optionweather.v_last_observationsfor a WMS last observation layersensors:weather_last_observations
These three layers were easily integrated in the SOSPilot Heron Viewer.
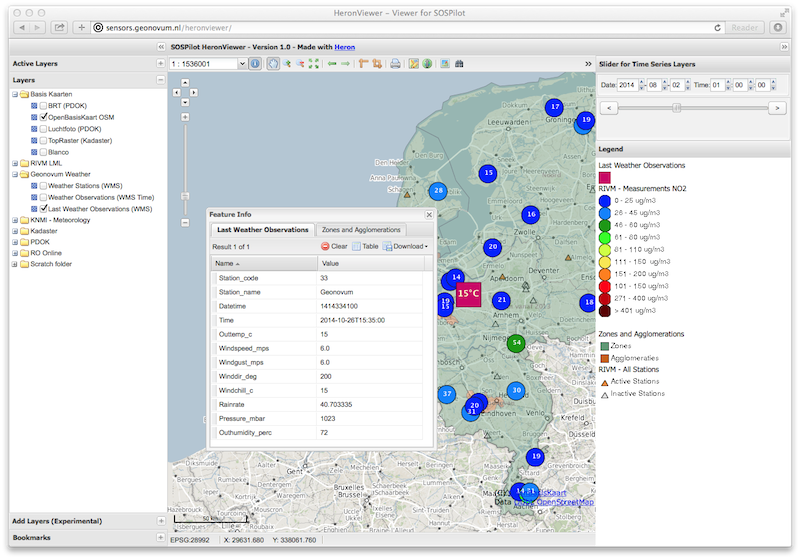
Figure 8 - Weather Data WMS Layers in Heron viewer
9.9. Stetl SOS
This ETL process reads measurements from PostgreSQL and transforms/publishes these to the SOS via SOS-T. The design Similar to the RIVM LML AQ SOS publishing setup.
Source code: https://github.com/Geonovum/sospilot/tree/master/src/weather/pg2sos
As the weather data is published in the same SOS as the AQ data, both data types can be combined in any of the SOS browser clients. An example can be seen in Figure 8: both outside temperature (deg) and humidity (%) are combined with NO2 (Nitrogen Dioxide) and PM10 (Particulate Matter up to 10 micrometers in size).
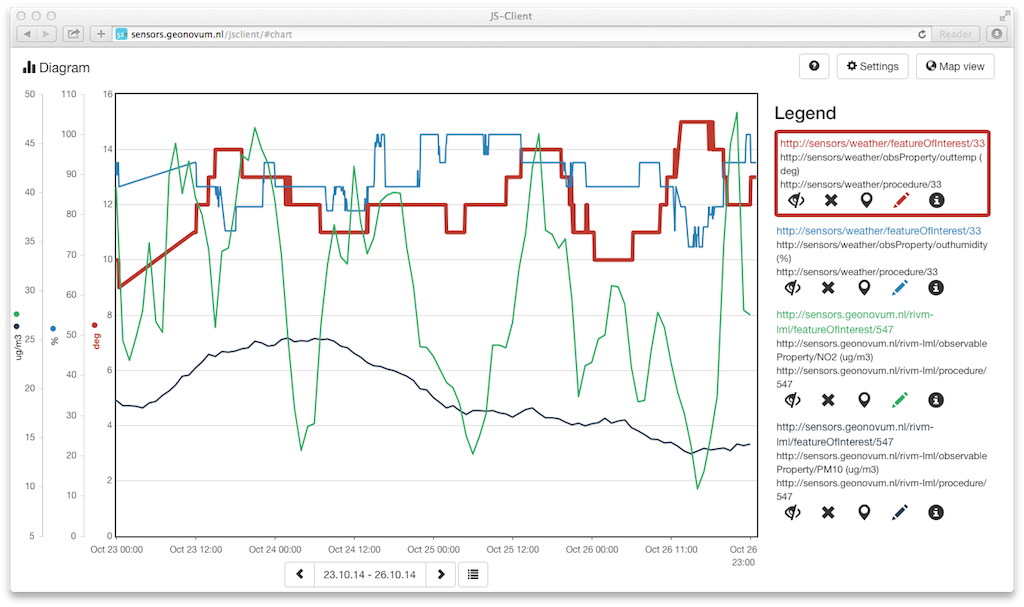
Figure 9 - Weather Data SOS Data integrated in 52N JS Client
Test with SOS requests: NB The SOS is not active anymore
- Station: DescribeSensor
- Temperature observations: GetObservation
9.10. Links
- RGI-189 Sensoren als databronnen aan de geo-informatie infrastructuur, Wiel Wauben, KNMI http://www.knmi.nl/~wauben/HIM/SWE%20KNMI%20evaluatie%20v3.pdf